Your SurveyGizmo reporting done. Without the effort.
No time for survey reporting or analysis? Need help or advice? You're in the right place!
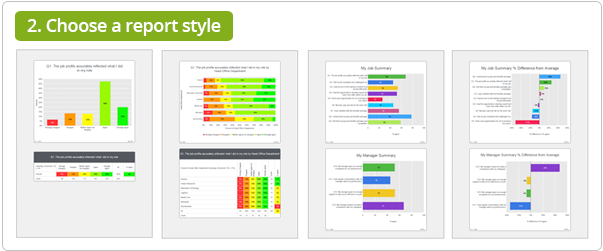
Get beautiful survey reports and fast insights in 3 simple steps:
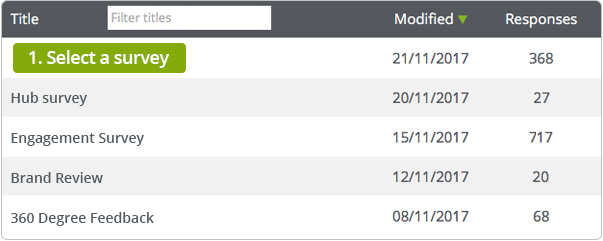

Try ReportGorilla FREE with your surveys now
Report Gallery - Discover what you can do
Discover all the things you can do with your survey data at the tap of a button

Explore the Report Gallery now
ReportGorilla in action
See how easily you can create reports and slideshows
3 quick survey design tips for better reporting
Use page titles
Page titles help give context and structure to both surveys and reports.
Use consistent scales
Using the same number of scale points and consistent labels makes for better summaries and also saves respondents time.
Avoid long explanations in question text
If a question needs a long explanation, try putting it in text before the question itself, i.e. in a page description (or in brackets after the question text, like this).
Pro tip: Test your reporting BEFORE collecting any data - FREE
This is a powerful learning tool and best practice step when designing surveys
We all learn through feedback. Even survey designers!
Realistic previews with test data let you visualise results before collecting answers. You can see exactly what your reports and slideshows will look like, share them with others and get their feedback or sign-off too. All before you launch you survey.
Using ReportGorilla previews as part of your survey design process
Just open your survey in ReportGorilla and run any available preview. You'll see exactly how your survey will be reported while you can still change your survey design. Since previews are free, you can do this as many times as you need to until you get your survey just right.
Make sure your reports deliver the insights needed to make better decisions
No more: "I wish I had included this question or asked that differently" when it's too late...